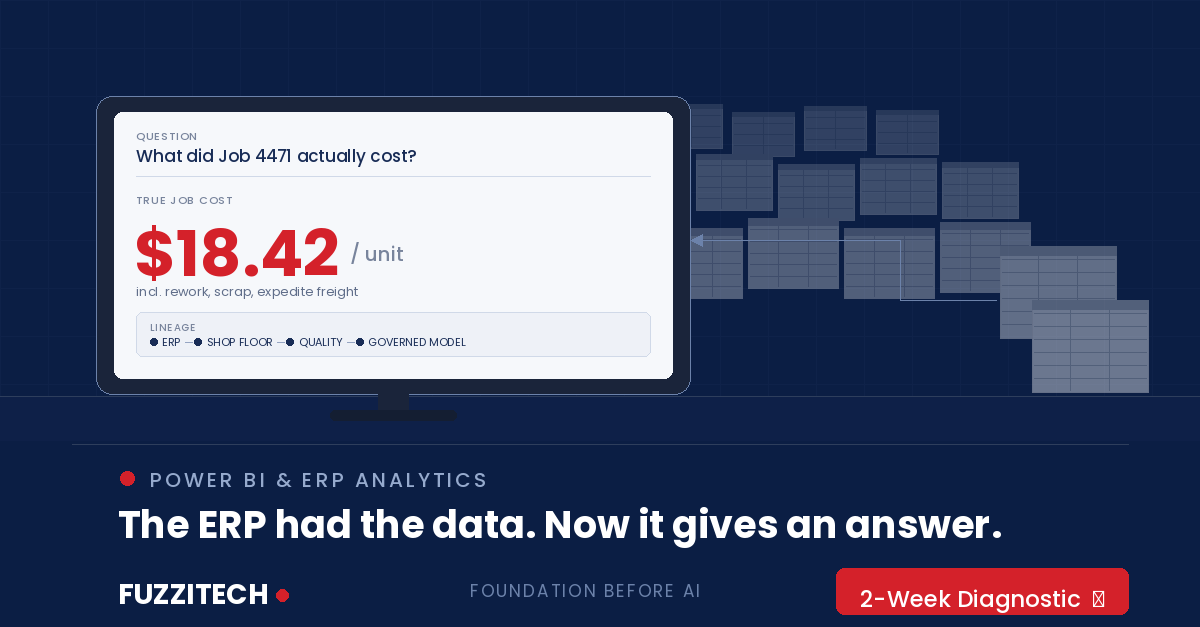
You paid seven figures for the ERP, and you still can’t get a straight answer to “what did that job actually cost us?” without someone exporting to Excel and working on it for two days. The reports that shipped with the system don’t answer the questions you actually ask. So your analysts have become a human query layer — and they’re the bottleneck on every decision.
The “before” state is one of the most common frustrations we hear from CFOs and VPs of Operations across the Midwest. The ERP is not exactly the problem. The data is in there. But ERP reporting is built for transactions, not for the questions an operator actually asks: which jobs are eroding margin, which customer is quietly unprofitable once you account for expedites and rework, which line is drifting off standard.
So a workaround emerges, and it always looks the same. Someone exports. Someone builds a spreadsheet. That spreadsheet becomes indispensable, then it becomes precedent, and within two years there are dozens of them — each with its own logic, its own definitions, and its own quiet errors that nobody has audited because nobody has time. The finance team runs the month-end close through this apparatus. The ops team runs the weekly review through a different one. When the two disagree, and they do, the meeting becomes an argument about arithmetic.
What actually breaks is speed and confidence. By the time the analysis is assembled, the decision window has moved. And because the numbers came from a manual chain, leadership hedges — they discount what they’re being shown, ask for it to be rerun, or make the call on instinct instead. That’s the real cost: not the analyst hours, but the decisions that were made late or on a number nobody fully trusted.
There’s also a version of this that bites hardest in supply chain. Margin, landed cost, and OTIF performance are exactly the questions that span ERP modules — and exactly the questions ERP’s canned reports handle worst. If you can’t see true cost-to-serve by customer, you can’t tell which accounts are worth defending on price.
Now, here’s where most Power BI projects go wrong, and it’s worth being blunt: pointing Power BI at a messy ERP produces a fast, beautiful, untrustworthy dashboard. You’ve made the wrong number prettier and easier to distribute. Dashboards do not fix definitions. Foundation first, then the visualization layer — that order is not negotiable, and it’s the difference between a BI rollout that sticks and one that quietly gets abandoned in eighteen months.
The Fuzzitech approach to Power BI & ERP Analytics starts underneath the report. In the 2-Week Diagnostic, we inventory the questions leadership actually needs answered, then trace each one back through the ERP to see what’s genuinely available, what’s fragmented across modules, and where the same term — job cost, margin, on-time — means three different things to three departments. We resolve those definitions first, with the people who own them, and build a governed semantic model on top of the ERP data. Then, and only then, we build the Power BI layer: dashboards that answer the operator’s real questions, automatically refreshed and drawn from a single agreed-upon source.
The measurable “after” is the trust dividend. Teams typically spend around 60% less time reconciling conflicting reports, because the export-and-rebuild ritual ends — the answer is already there, and it’s the same answer everywhere. One trusted dashboard replaces the five-plus spreadsheet variants that used to circulate before every review. Your analysts stop being a human query layer and go back to doing analysis. And leadership stops hedging, because the number in front of them has a lineage they can point to. (Any specific close-time or margin-recovery figures beyond those anchors are illustrative until we baseline your environment.)
There’s a quieter payoff we’ve come to expect. Once the governed semantic model exists, the questions get better. When getting an answer takes two days, people only ask the questions that are worth two days. When it takes ten seconds, they start asking the ones that actually move the business — and that shift in behavior tends to outlast the dashboard itself.
This is also, not coincidentally, what makes an ERP copilot viable. Natural-language querying only works when the underlying model is governed; ask a copilot a question over ungoverned ERP data, and it will answer fluently and incorrectly. Foundation, then analytics, then AI. Same order, every time.
Power BI on top of an ungoverned ERP doesn’t give you answers — it gives you faster arguments.
Start with the 2-Week Diagnostic. We’ll map the questions your ERP can’t answer today, resolve the underlying conflicting definitions, and hand you a prioritized analytics roadmap in 14 days.
Learn more about how this can be applied to your manufacturing: Power BI & ERP Analytics for Manufacturers | Fuzzitech
See the manufacturing use cases → https://fuzzitech.com/use-cases/manufacturing-use-cases